If you work in retail marketing, the chances are high that you have already made data-driven design decisions at certain points in your career.
You need to launch campaigns with messages that stick, win attention on social media, and stand out from the competition with in-store experiences that align with current trends and customer behavior. Using data can help you validate your decisions and also solve problems in new and innovative ways.
Here are a few ways to accelerate your response to the trends that will transform the marketplace in 2022 and drive revenue with data-driven design decisions, both online and in-store.
But first, let's throw light on what data-driven design is, why it is a must to engage with it and how to collect the data you need to reach your targets.
You can also just skip to the section that jumps out at you.

What is data-driven design?
Data-driven design is the approach and practice of basing design decisions on collected data rather than personal preferences or intuition. Data about customer behavior, attitude, and attention could help you understand how people interact with your brand or product and can allow you to introduce changes in your communication or design that support real customer needs. Data can inform how you design your brand image or any visual asset and can also boost physical and digital customer experiences.
From in-store to in-app experiences, customers meet your products and brand through a vast range of touchpoints, and you can learn from every interaction. Data analytics helps you learn more about your customers, enhance your existing solutions and bring out innovations like hybrid experiences that blur the lines between online and brick-and-mortar retail. Understanding your customers and their behavior is also vital to building personalized interactions that offer customers an experience they have never had before.
Data-driven decisions are transforming industries for the better, whether they improve customer service, illuminate strategic decisions or enhance marketing and branding efforts. And when you are fighting for a scarce resource like your potential customers' attention, balancing along with your gut feeling is no longer enough.
Data-driven decision-making can boost conversions and propel your marketing efforts forward. It can be risky to rely solely on your instincts and ignore first-hand data and real-world feedback. It may result in ineffective designs, leading to wasted resources, and even damage your brand image.
A data-driven design approach would not only improve the success of your marketing department but also assist designers in increasing efficiency. You can significantly reduce the number of iterations and revisions required to complete a design task by conducting user research and running pre-tests on your assets. As a result, a designer can accomplish a more efficient piece in less time. It is clear that incorporating a data-driven design principle will benefit your creative teams in the long run.
There are many buzzwords in use around data in the sphere of business. First, people started talking about "data-driven" design, then Adam Mosseri gave a talk and coined the term "data-informed", and some prefer to move towards a "data-inspired" approach. They are all fundamentally asking us to acknowledge that we could combine the use of data and intuition on different scales in different contexts.
It is best to put data at the center of your decisions when you want to validate an idea or optimize a specific part of your product or offering, like reducing the bounce rate on a landing page or lowering cart abandonment rates. If you're looking to make strategic and fundamental design decisions like increasing long-term customer engagement, you should think critically about whether data can be extrapolated to the future or not.
Consider data as a tool that helps make sound decisions. Doing research plays a critical role in helping marketers, content writers, and UX designers better understand their target audience, create engaging content, and offer the best possible user experience for online shoppers. Designers can also use data to validate ideas and support design decisions. Qualitative data can also provide a clearer picture of the demands and motivations of clients and align design outcomes accordingly.
But do bear in mind that no data is flawless, and every type of data collection method has its own set of limitations and biases. Use all methods and insights with care and always treat them in the right context.
Data collection methods and techniques
Collecting data can help you with all aspects of the business, from market research through customer insights to informing design processes. You can collect data yourself by conducting customer interviews, analyzing web activity, collecting scores of cognitive tests, or using A/B testing to validate design decisions. For a well-rounded view, always use data from a variety of sources and combine both quantitative and qualitative data together. The two types of methods can easily supplement each other. There is a great variety of methods for you to choose from.
Quantitative data can be measured through concrete numbers and values, and it answers questions such as "how many" and "how often". A/B testing or split testing, website analytics, and attention heatmaps are all widely used examples of quantitative data collection methods.
A/B testing or split testing
A/B testing (also known as split testing, sometimes referred to as bucket testing) is a design and conversion optimization strategy that compares two (or more) versions of a design asset to determine which variation performs better for a given goal. This method allows you to test not only creative assets but also web pages, landing pages, Facebook or search ads, apps, and emails. Regularly running A/B tests will help you fine-tune your design for your target audience's needs.
Web analytics
You can also collect behavioral data by measuring web activity. If you are mapping out your potential audience, use so-called off-site web analytics methods, and collect data from other online sources than your own website, such as social media platforms, search engine rankings, and comment threads.
When it comes to understanding how people engage with your site, you can measure visitor activity with powerful tools like Google Analytics. You can also run attention prediction tests to determine whether people would notice specific elements of your website and learn how likely they are to engage with crucial functions or new content.
Heatmaps
You can also rely on heatmaps to understand where customers are looking while shopping in-store or watching digital content on a screen. Heatmaps come in many different types, with diverse goals and applications, but they generally help you measure user interaction and consumer attention.
To measure website interactions, marketers often use traditional heatmaps like scroll maps and click maps. A scroll map is a form of website heatmap that can inform you about how far people scroll down a page on a computer, mobile device, or tablet. Click maps help track on-page user engagement and display where users click on a website.
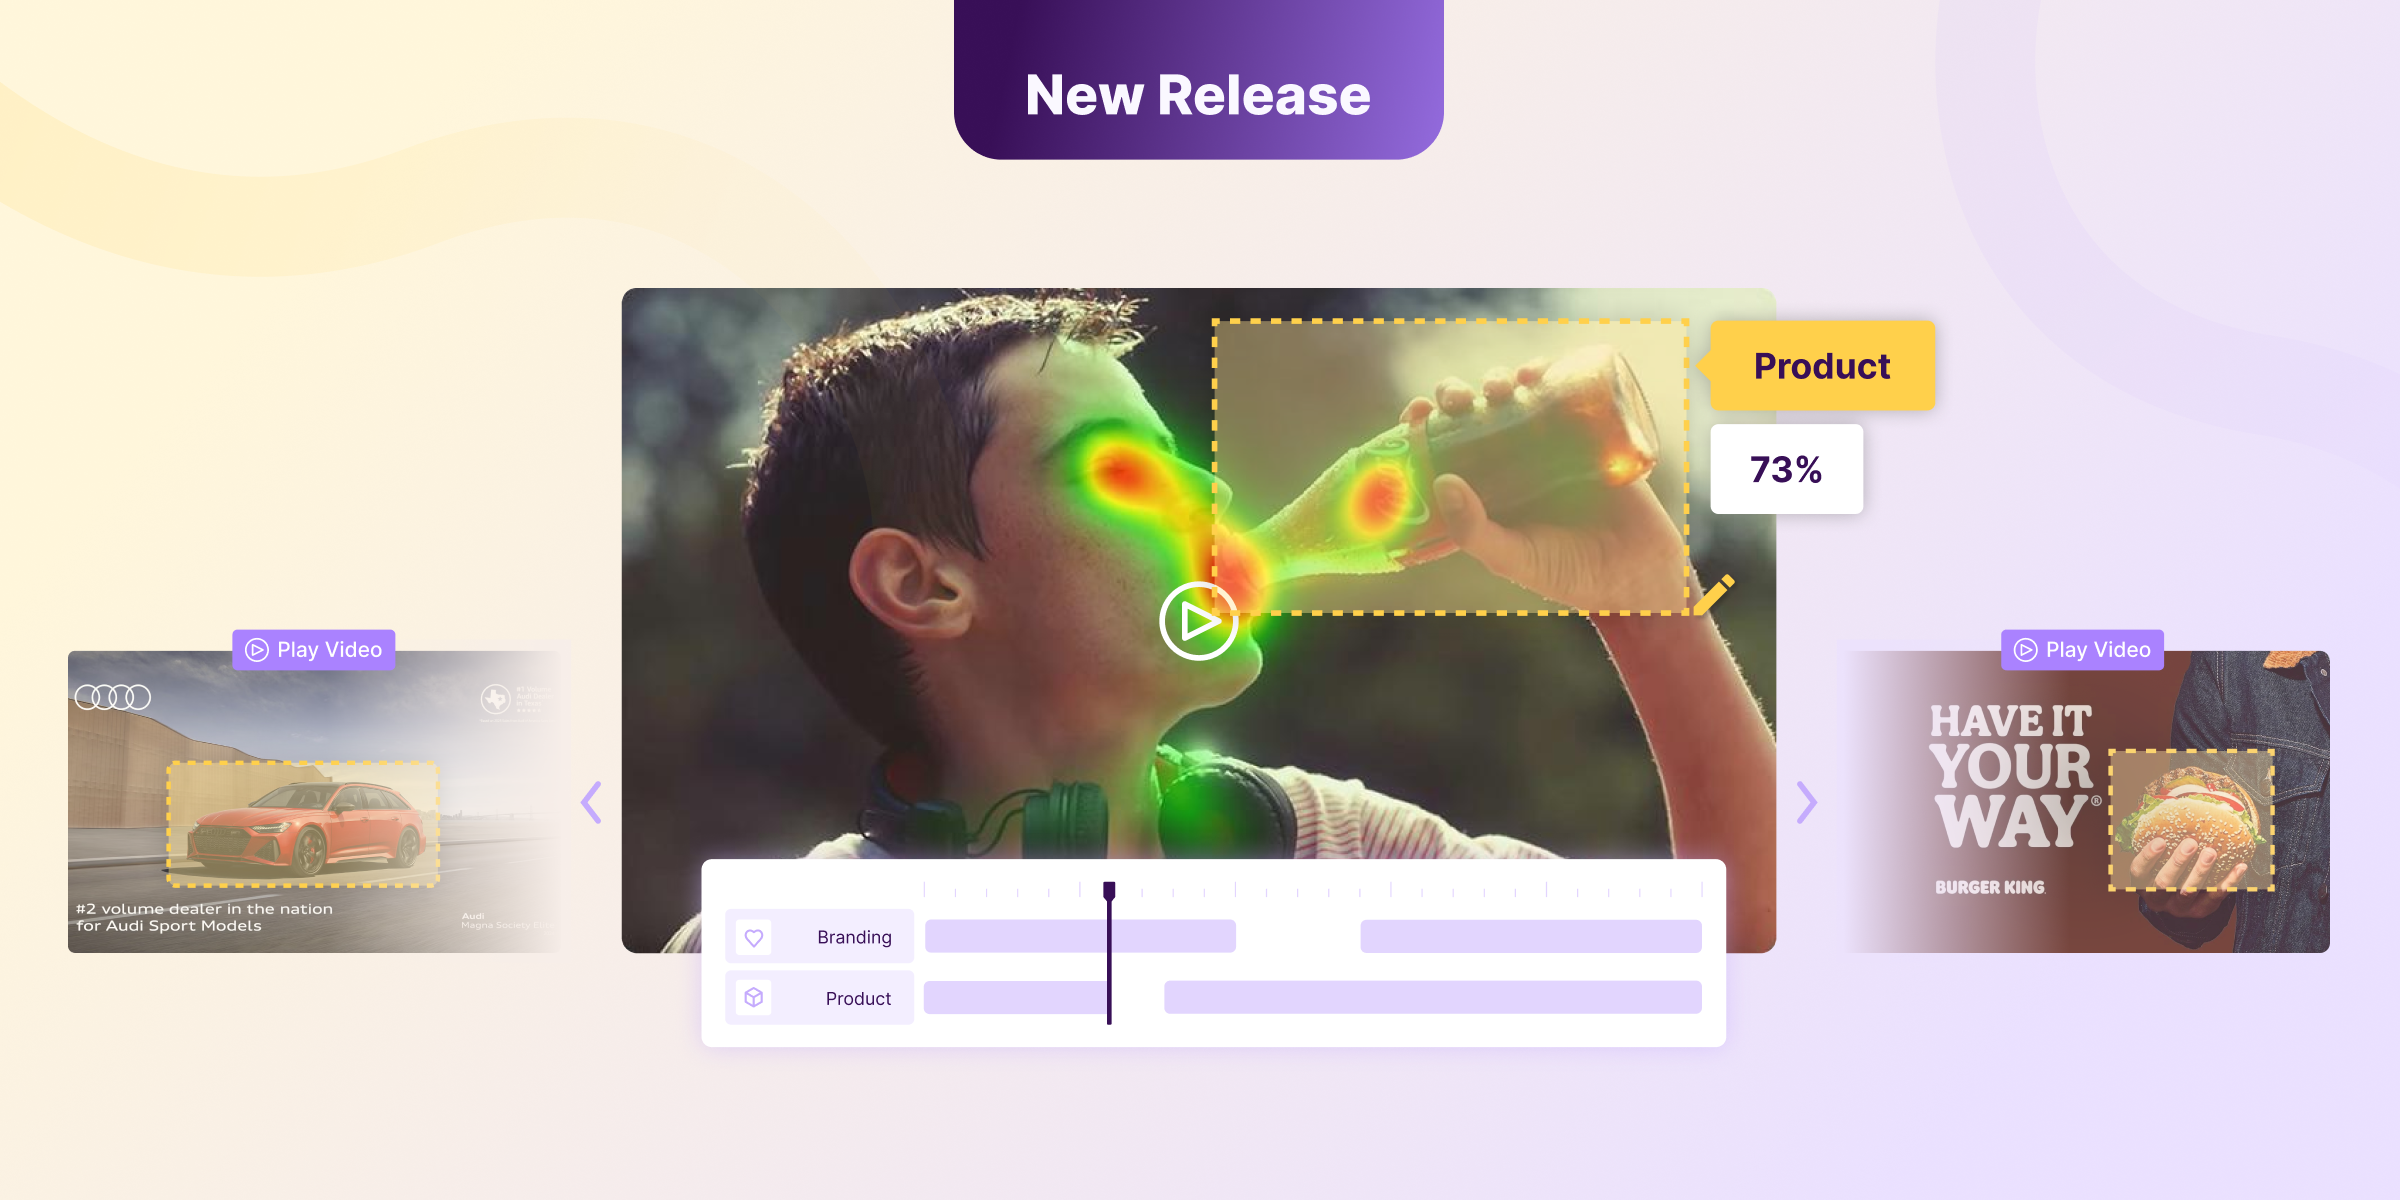
You can also measure the attention of your users and audience and get attention heatmaps to make better design decisions. You don't need to invest in full-scale studies and recruit participants, as there are cutting-edge automation tools already out there that make attention testing easy, quick, and affordable.
For example, Neurons' cloud-based attention prediction tool called Neurons AI is built on behavioral datasets that are already cleaned and ready to be used to predict unique outcomes like consumer attention or ad performance. With such tools, you can make data-driven decisions right from the start. You can minimize the number of design iterations while designing for unconscious mechanisms deeply embedded in the human brain.
Sample surveys
Asking people for their opinions in a structured way, like with surveys and questionnaires, can easily be categorized as a qualitative approach. But to get reliable results, it is essential to use a representative sample and survey a fairly large number of people of your target audience. Once you have data from a large sample, you can let statistics guide you to build up a clearer picture of your customers.
Qualitative data describes characteristics and refers to qualities like feelings, opinions, and observations that can't be expressed with numbers. Collecting qualitative data will help you disclose some of the demands and needs of your target audience so that you can offer a solution that gets the job done.
Customer interviews
Talking directly with your consumers can be a great way to collect data about their needs and anxieties. There is no one-size-fits-all approach to conducting customer interviews. They can be pre-planned and scripted, or they can be more unexpected, such as asking a few additional questions during a call or a meeting. Customer interviews will help you empathize with your customers and learn your customers' vocabulary so you can communicate with them more effectively. However, interviews and open-ended questions, in general, suffer from self-report pitfalls and are unable to capture subconscious mechanisms.
Customer journey mapping
Visualization and mapping tools transform customer touchpoints into visible dimensions, clarifying which interactions contribute to the overall customer experience. A common mapping exercise is customer journey mapping (also known as user journey mapping), generating a visual representation of how your ideal customers interact with your business. This exercise allows you to put yourself in your customers' shoes and see your product and brand through their eyes. It also helps you learn about customer pain points and gives you more straightforward directions on addressing them.
Competitor analysis
You can run a competitor analysis to compare and contrast your company's strengths and weaknesses with those of your competitors. You can conduct a high-level competitor study or delve into a specific area of your competitors' business. Updating your competitor analysis or even running it from scratch on a regular basis will help you spot new market trends and maintain a competitive advantage over your competitors.
How do you apply data-driven design in retail?
The data-driven path that, among many, the retail industry has begun to take is leading to realizing the necessary cost savings, boosting sales, and making your business future-proof. Your data collection and analysis efforts can enable you to build seamless online and in-store shopping experiences, creating an engaging packaging design and achieving better conversion rates online.

It is without a doubt that physical stores remain a critical force for retail shopping, with 84% of all US retail sales coming from physical stores in 2021, according to eMarketer. The so-called shelf battle is closer than ever, and it is challenging to get the consumers' attention in this busy and overcrowded environment.
Customers have more and more choices, and the limited display space and flexibility make it even more challenging to get your products noticed. You need to guide customers in finding your products and boost brand visibility, capturing their attention for even a moment. Something as simple as framing your product, reconsidering the self background, or tweaking the lighting can help you reduce shelf cluttering. An interactive display can also speak to the customers in a way that they find engaging.
Collect data on new ideas and test solutions in the early stages of the design process with attention prediction tools like Neurons and launch the most effective design without wasted resources.
According to recent neuroscience research, by the time a consumer blinks, their brain has already seen and processed a mobile ad or a piece of visual content. And more so, by the time it takes for their heart to beat once, they have very likely formed an emotional response.
To win attention in such harsh circumstances, try and experiment with short formats, put more emphasis on grabbing attention in the first second of your online ads and run tests to gather data on your proposals. Remember that messages that stick and get under your audience's skin can come in a fraction of a second, so make that extra step, prepare and test your creatives before launching live.
An effective UX design that incorporates well-placed features and product displays is essential to any online store's success. An impractical site design is one of the key causes of high bounce and cart abandonment rates. A lack of visual emphasis on crucial elements such as the cart or a simple checkout progress can leave you lost opportunities.
While e-commerce is now a crucial channel in retail, you need a clear design concept to provide a smooth user experience. Slight changes in website elements like redesigning your buy button can dramatically affect performance and could lead to higher conversion rates. Challenge your established user journey and gather data on customer behavior to reveal what functions might fall through the cracks and what blocks your potential customers from completing their purchases.
Your package design is an integral part of your unique brand identity. Therefore, creating an aesthetically pleasing package design that aligns with the ethos of your brand is vital for crisper marketing and improved sales of your products.
But it is at least as important to launch a design that draws attention and makes your product land in your customers' shopping carts. The design should be trendy and cool, of course, but not at the cost of the main use it should have for the customer. Packaging design is an excellent opportunity to win customers, but you're also running the risk of losing their interest with the wrong approach. Consider running rapid design tests for in-store attention to make the right design decisions on color, font style, packaging layout, and printed information.
Get started with data-driven design
Now that you have a handful of methods under your belt, let's get your hands dirty and make data-driven design an actionable approach that helps you overcome day-to-day challenges.
Data enters your company from a variety of sources, including employees, customers, partners, social media, and the web. To seize these data opportunities, you need to pinpoint your existing and desired data sources. Until you take a closer look, you may not realize how near or far you are from where you need or want to be.
Start your next data-driven design project by setting the scene first. Determine the context, set realistic goals, and think about an assumption to test. Let's say you want to increase e-commerce conversions, and your product pages show some room for improvement. Your assumption could be the following: if contrasting color combinations draw more attention, then making the "Add To Cart" button of contrasting colors to its background will boost online sales because it will be easier to notice, and visitors will be more likely to click on it.
The results of these trials will tell you whether you truly grasp your customer's world and how well you comprehend the opportunities or limitations of your existing solutions or new design proposals. Every hypothesis investigated has the potential to yield new insights for future stages of your product's development. As a result, developing them based on research and data is vital for long-term success.
Now that you have set the direction of your data-driven research, depending on the goals you have set, you can choose what type of data you need and the methods to collect it. You can also turn to resources and datasets that are already available for you before you start thinking about other tools or data collection methods.
Once you master a method, you can complement your strategy with new tools or new types of data. Consider the data-driven approach as a series of iterations. You can't just conduct data analysis once and consider the job done. Instead, you should test your hypothesis on a regular basis.
Data is usually just a few clicks away when you dive into customer analysis. You can explore customer data that’s already in your CRM or sales database. Analyze your audience, create segments and take a look at your website analytics data to understand how people spend time on your page.
Once you’ve started validating and disproving your guesses about your customers, you can get more information about the whys and hows. This is where qualitative data from customer interviews, product reviews, chat logs, and social media reactions can be incredibly useful. You can further combine these findings with website polls and NPS scores.
Analyze this new information and create ideal customer profiles or buyer personas using recurring themes and patterns that you uncovered from this research. Feel free to use quotes and define pain points and jobs to be done using your customers’ own expressions to better illustrate their world.
You can also aim to understand consumer behaviors like attention and probe unconscious responses. There are methods and tools that help you analyze your target audience simply based on how we're wired. You can apply this method to your pre-testing strategy, so you can avoid wasting resources on a media campaign that fails to draw attention.
Using data visualization tools like charts, graphs, and heatmaps will allow you to analyze trends and quickly find patterns or anomalies in your data. Representing data visually can also help you provide a solid ground when discussing soft topics and sharing results with your stakeholders.
At the end of the day, you don’t need to leverage advanced data-collection methods and complicated tech tools to make well-informed decisions. From mapping customer insights to supporting design decisions, the technologies that drive the most profitable decisions and strategies today actually are automated solutions. These tools can offer you actionable insights you can use to produce visual assets and campaigns that evoke the desired feelings and draw attention. For example, the automated attention prediction tool Neurons AI exploits vast amounts of behavioral data to predict consumer responses. It is powered by a machine learning model that is constantly fed with scientifically validated data to generate the most accurate attention heatmaps and cognitive scores.
Conclusion
Now that we covered extensive aspects of the data-driven design process, you are ready to use the data available to you to be well-versed in your industry and identify challenges in your business. This strategy can also add considerable value to the company by improving customer experience, increasing conversions, and boosting long-term ROI. It may take some time to master these strategies, but it is well worth the effort. In the long run, it will reap enormous benefits.
Relevant sources to learn more
Boosting brand visibility in retail advertising
What's in a great package design?
Boosting the e-commerce buy button
What is your 1-second digital ad strategy?