What is a heatmap?
A heatmap is a tool that uses color to graphically represent complex data, making it easier to visualize and understand.
Heatmaps originated in the 19th century, when they were manually drawn onto a grid system in grayscale. One of the earliest heatmaps was used to depict the population of districts across Paris, as you can see here:

It is still possible to make heatmaps manually, however, it’s much more common to employ the help of a heat mapping software. Nowadays, heatmaps have mostly moved on from grayscale and employ a more rainbow-like color scheme: all the way from red, through yellow, green, to blue.
They’re commonly used to represent geographical data, but as their usage evolves with time there are more ways to utilize them. Modern heatmaps can be used to measure clicks on a website, attention spots, scrolling, and more.
How does a heatmap work?
The most used formats to overlay heatmaps on are images, however it is possible to utilize this tool for videos as well. We’ll use an image as an example.
Most heatmaps use a spectrum of colors from red to blue to visualize data points. The warmer tones indicate higher data values, and cooler tones represent data values that are lower.

Some heatmaps, such as click heatmaps, which we will explore at a later point, use shades of a single color where the darker the color, the higher the value and vice versa. The exact way a heatmap works depends on its use and purpose, but the base is always the same.
How do you use a heatmap?
There are many uses of heatmaps, depending on the purpose and type of heatmap that’s being used. They are best used in combination with other data, as is the case with anything, and they can be used to support that data in reports, projects, etc.
Heatmaps are commonly used for analyzing user behavior after it’s already happened - a website heatmap can tell what the most clicked area is, where people stop scrolling, how people generally act when visiting a website, where they look and how they navigate.
This kind of data for heatmaps is collected after the user has already gone through the journey, but there is also a way to predict those responses, which we’ll talk about further.
The benefits of using heatmaps on your website
Conducting customer research can be timely, costly and tedious; employing tools like surveys can be unreliable, because people can get bored of them and answer questions just to get through. Heatmaps are a non-intrusive way of researching customer behavior on websites. There’s no one directly observing the customer, which could in itself skew the results, nor is the customer being asked questions about their experience which they might not know how to answer.
A website heatmap is a direct, easy and inexpensive way to test customer satisfaction and user experience from the comfort of your office.
UX design
Heatmaps offer an in-depth understanding of the user experience supported by solid data, so it's easier to understand if any part of the experience has to be tweaked or changed to improve it.
When using heatmaps for UX design, you’re able to:
- understand which elements get the most attention and which are overlooked
- know where people click most often, or if they mistake an un-clickable element for one they can click on
- test multiple designs and layouts for a smoother experience
- argue for design changes supported by easily understood data
Product design
Heatmaps are useful for product design, whether it's a physical product or not, as they help understand where the users of this product will look, click, or otherwise. They can help identify parts of the design that might not contribute to the overall user experience, or parts that might be crucial but overlooked.
In product design, heatmaps are useful for a multitude of things, some of which are:
- finding ideal placement for any elements that need to be included both with digital or physical products
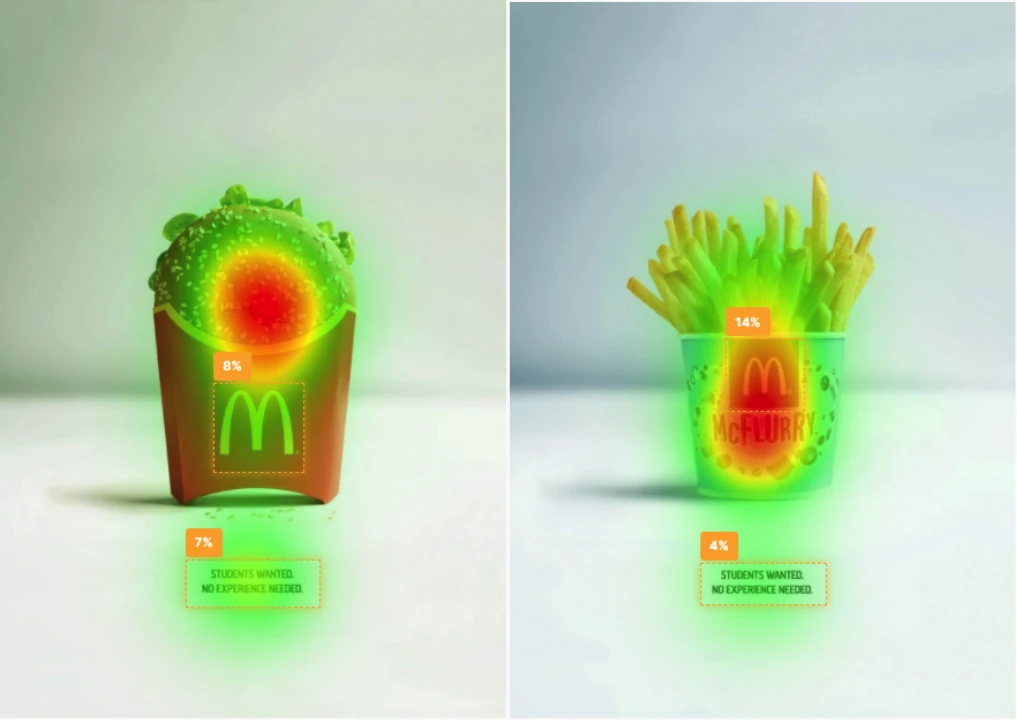
- testing if the product stands out compared to competitor products and grabs attention using attention heatmaps (e.g. for physical products - does it stand out on the shelf/display among other products?)
Marketers
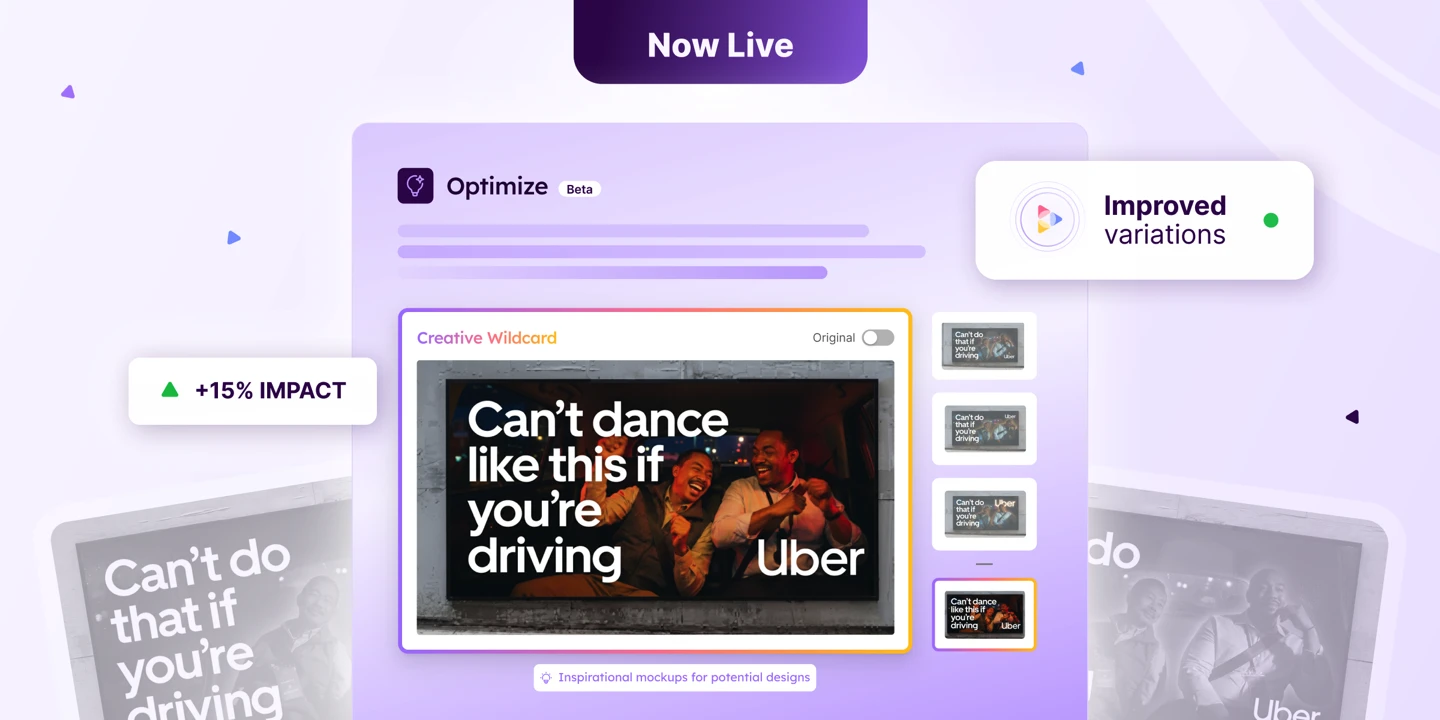
Heatmaps help you make sure that your ads are effective, and your budget is being spent wisely on things that work. They take guessing out of the equation, because you can test the performance of ads before you even launch them.
Heatmaps allow marketers to:
- find the perfect placement for a call to action and other crucial elements to your creative
- narrow down your choice of creatives to use for ads, without the need to spend budget on extensively A/B testing different layouts
The different types of heatmaps
There are many different types of heatmaps with various purposes and uses, although we can generally divide them into two categories: interaction and attention heatmaps.
Interaction heatmaps measure the engagement of a user, such as their interactions with a website, like clicks, scrolling, mouse movements and more.
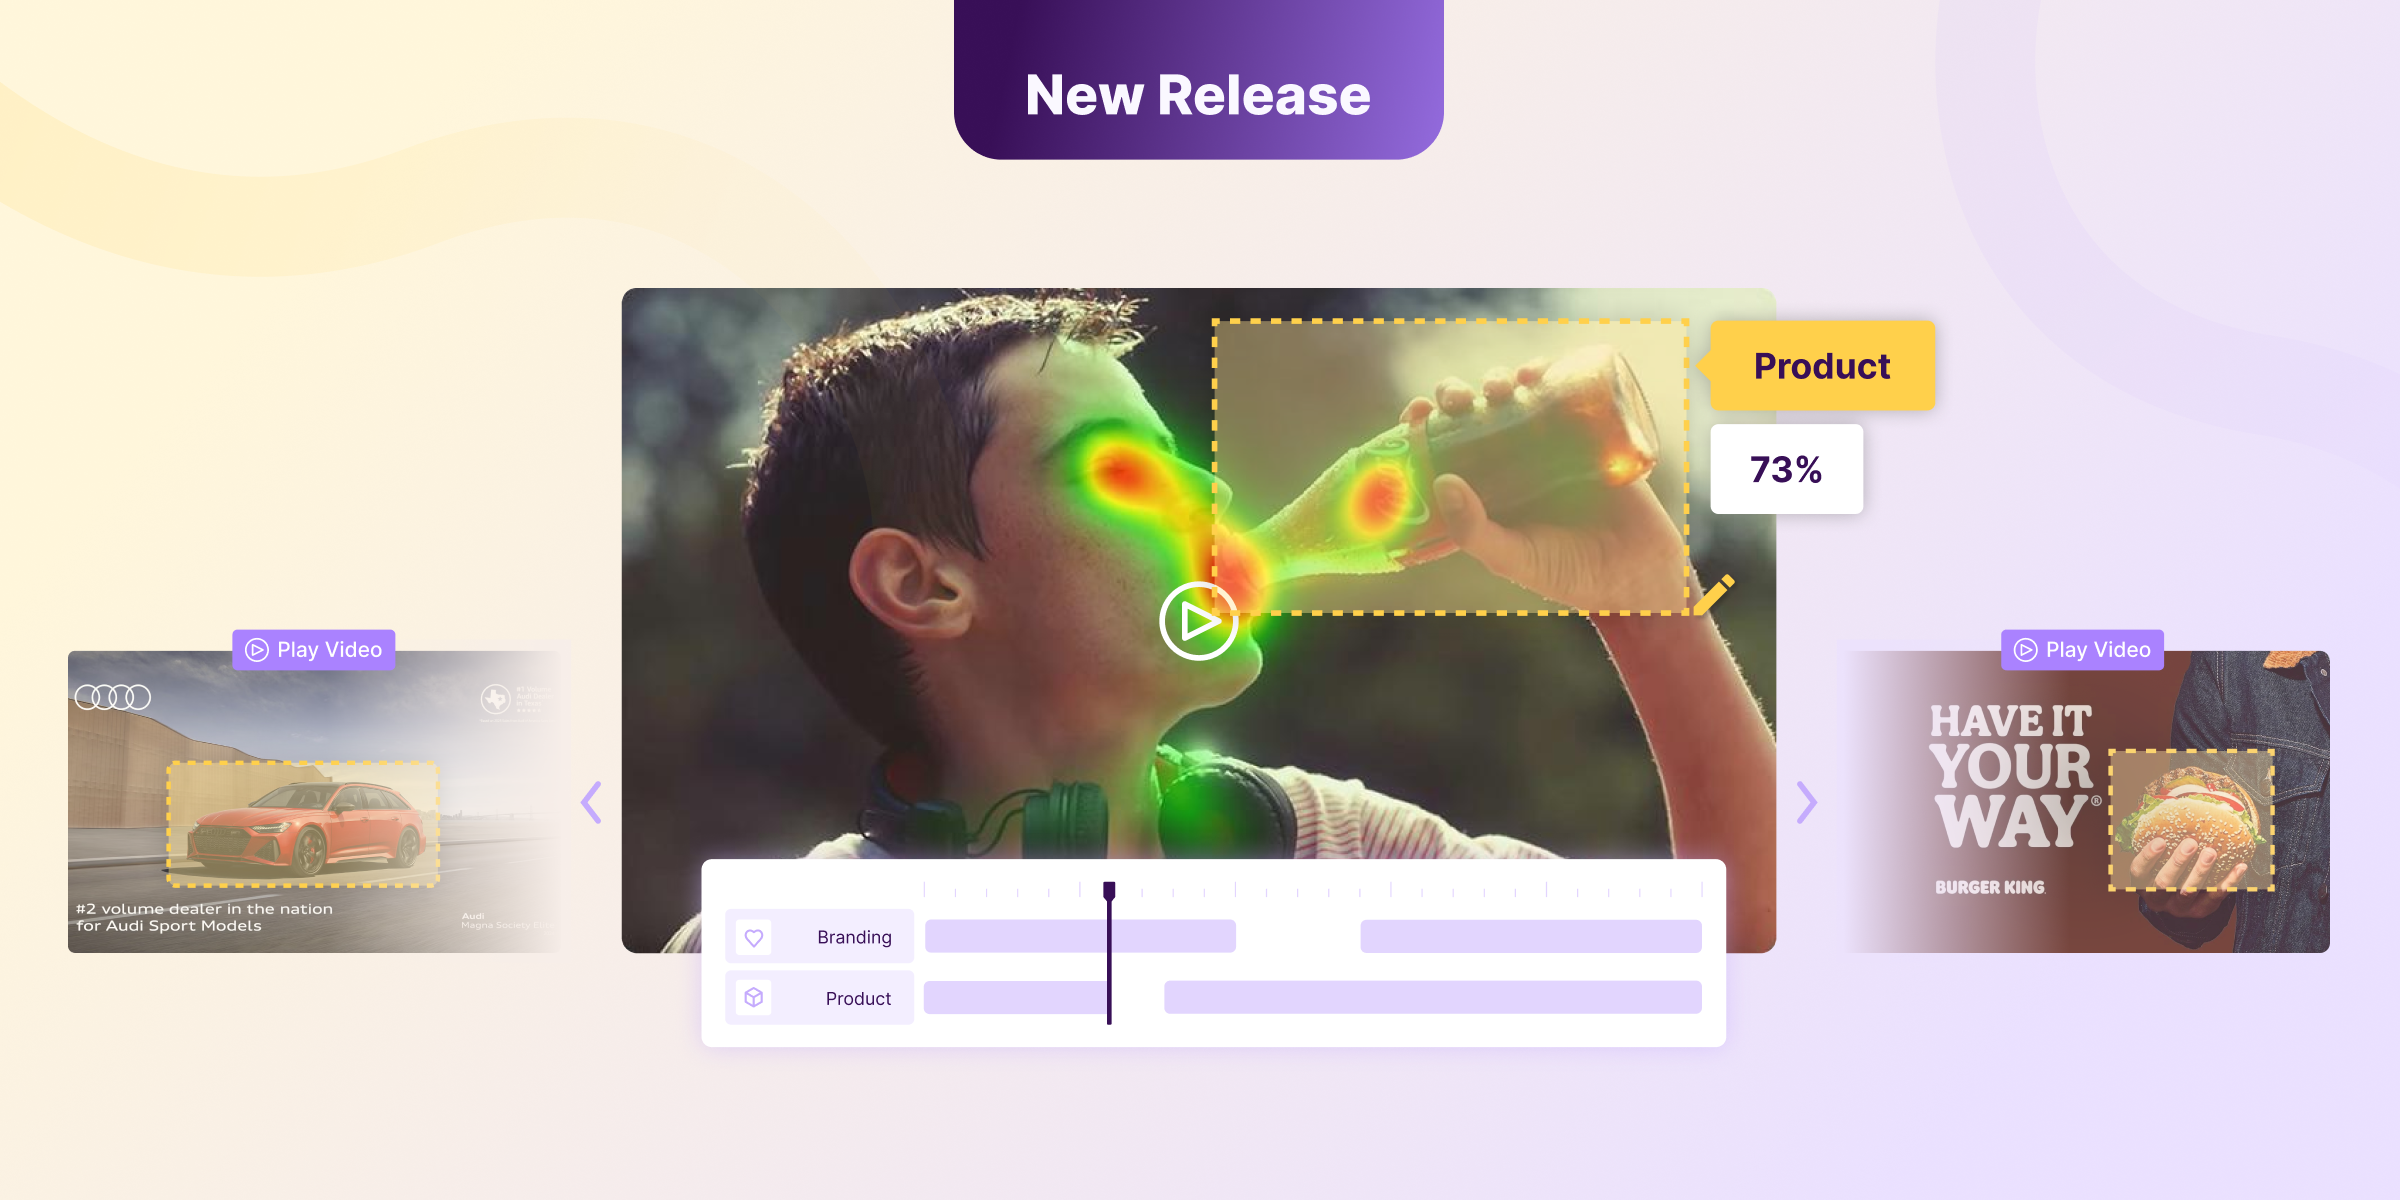
Attention heatmaps provide insight into the way users look at your website, creative or other, by monitoring or predicting their eye movements.
Click Heatmaps
A click heatmap helps measure any clicks happening on a website. It allows you to see what elements users are clicking on, which ones are clicked on the most and least. You can also discover any un-clickable elements on your website that seem clickable to a user, and can take the appropriate action to then remedy that.
Click heatmaps don’t only show where a user clicks, but also how many times. When a user clicks on an element many times in succession, it can indicate that the page is not loading fast enough which will increase bounce rate.
Scroll Heatmaps
A scroll heatmap measures how far down a page users scroll, if they scroll below the fold line, or if the website has a “false bottom”.
A false bottom appears when users scroll down a page and think they’ve reached the end - it might be the design that prompts them to think that way, but either way, they will often not scroll further and any information placed below that false bottom will not be seen.
Most often, people don’t scroll very far at all, so any important information should be place at the very top of the page where it’s most likely to be seen.
Attention Heatmap
An attention heatmap is similar to a scroll heatmap in looks, but measures time spent on a part of the page instead of scrolling. They’re useful in determining what content holds user attention the most, where to place calls to action, or if there’s any content that needs to be cut because it’s getting little to no attention.
Movement Heatmap
A movement heatmap tracks the movement of the mouse cursor. Users often hover over what they’re reading with their mouse cursor, so this heatmap can, to an extent, indicate what users are looking at. There are differing opinions as to whether this type of heatmap is useful or not, as it's very open to interpretation and it's possible that many users will move the cursor in a random pattern instead of where they're looking.
Geographical Heatmap
A geographical heatmap, simply put, shows geographical locations of users of the website. This is represented by “hot spots” on a world map, where the higher the concentration of users the warmer the color.
Eye-tracking heatmaps
Eye-tracking heatmaps are the most accurate, as they take data directly from eye-tracking glasses that a user is looking through. In this way you receive invaluable information about what a user is looking at on your website, creative, product or other, with very high accuracy. Though eye-tracking is not without its cost, as it’s a very timely and expensive endeavor.
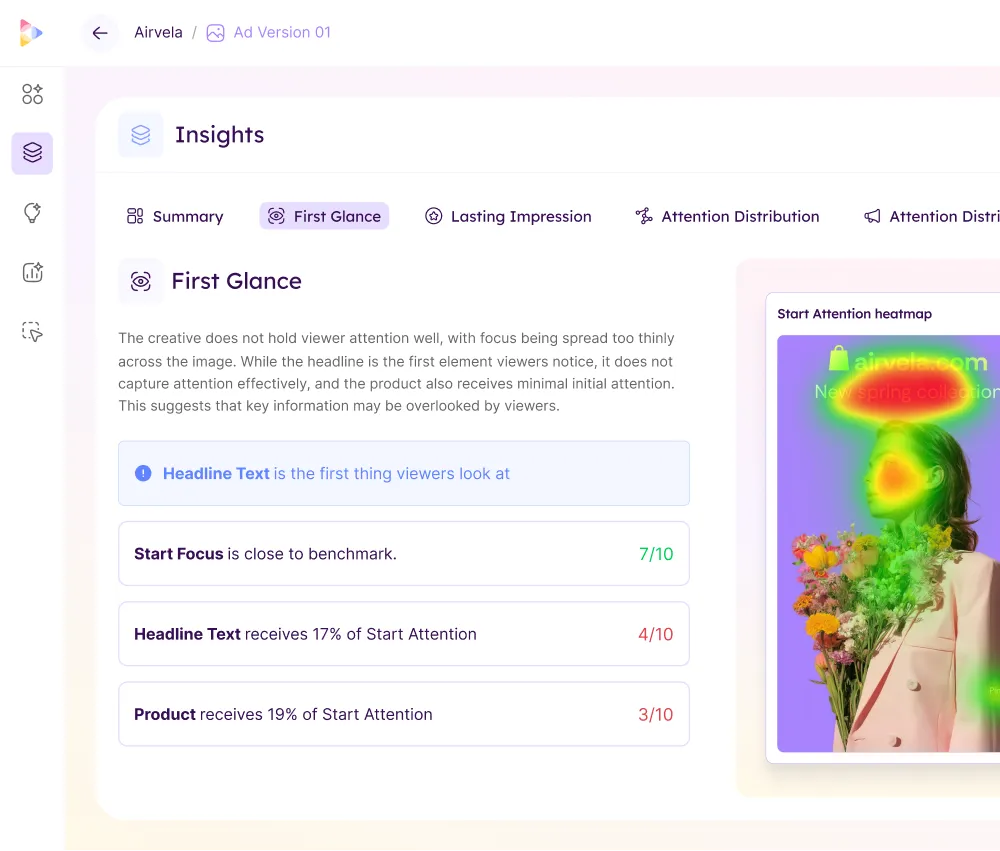
AI-generated heatmaps
By pulling in data from public or private libraries of eye-tracking data, machine learning can utilize a complex algorithm to generate an attention heatmap to show where a user is looking. They are similar eye-tracking heatmaps, as that’s the data they’re based on, but depending on the AI they can be more or less accurate.
Neurons vs Traditional heatmaps
Traditional heatmaps display data that's already been collected from past users, but Neurons AI can predict customer responses before they happen. It doesn't rely on past data from your users, as we've done all that work for you.
We've done extensive research and built a database of over 12,000 participants throughout all of our different studies. In this way, we've built our own private library of eye-tracking data, ensuring that we can provide only the best quality of data possible.
This eye-tracking data combined with our constantly improving algorithm puts Neurons at over 95% accuracy when compared to traditional eye-tracking. At a fraction of the cost of traditional, timely studies, it's a no-brainer to try it out for yourself, and book a demo.