What happens when your TV ad is “neuro-tested”? How are the ads analyzed by neuroscientists and what do they look for when analyzing consumers’ brain responses? And more, how can these analyses be used to boost your ad design and effectiveness?
Here, we will untangle intricate NeuroMetrics, go through the main steps of neuro-analysis, and take a sneak-peek into the world of applied neuroscience.
The following ad examples we will present were used as filler ads during larger studies, testing the effects of certain TV commercials that won’t be disclosed in this post.
Will it be noticed?
No matter how creative, original or even breath-taking a video ad might be, there’s always the question: will your message be noticed? Whether it is the actual product, a catchy slogan or any informational text, branding elements should get the chance to be looked at, to fulfill their ultimate purpose of brand communication.
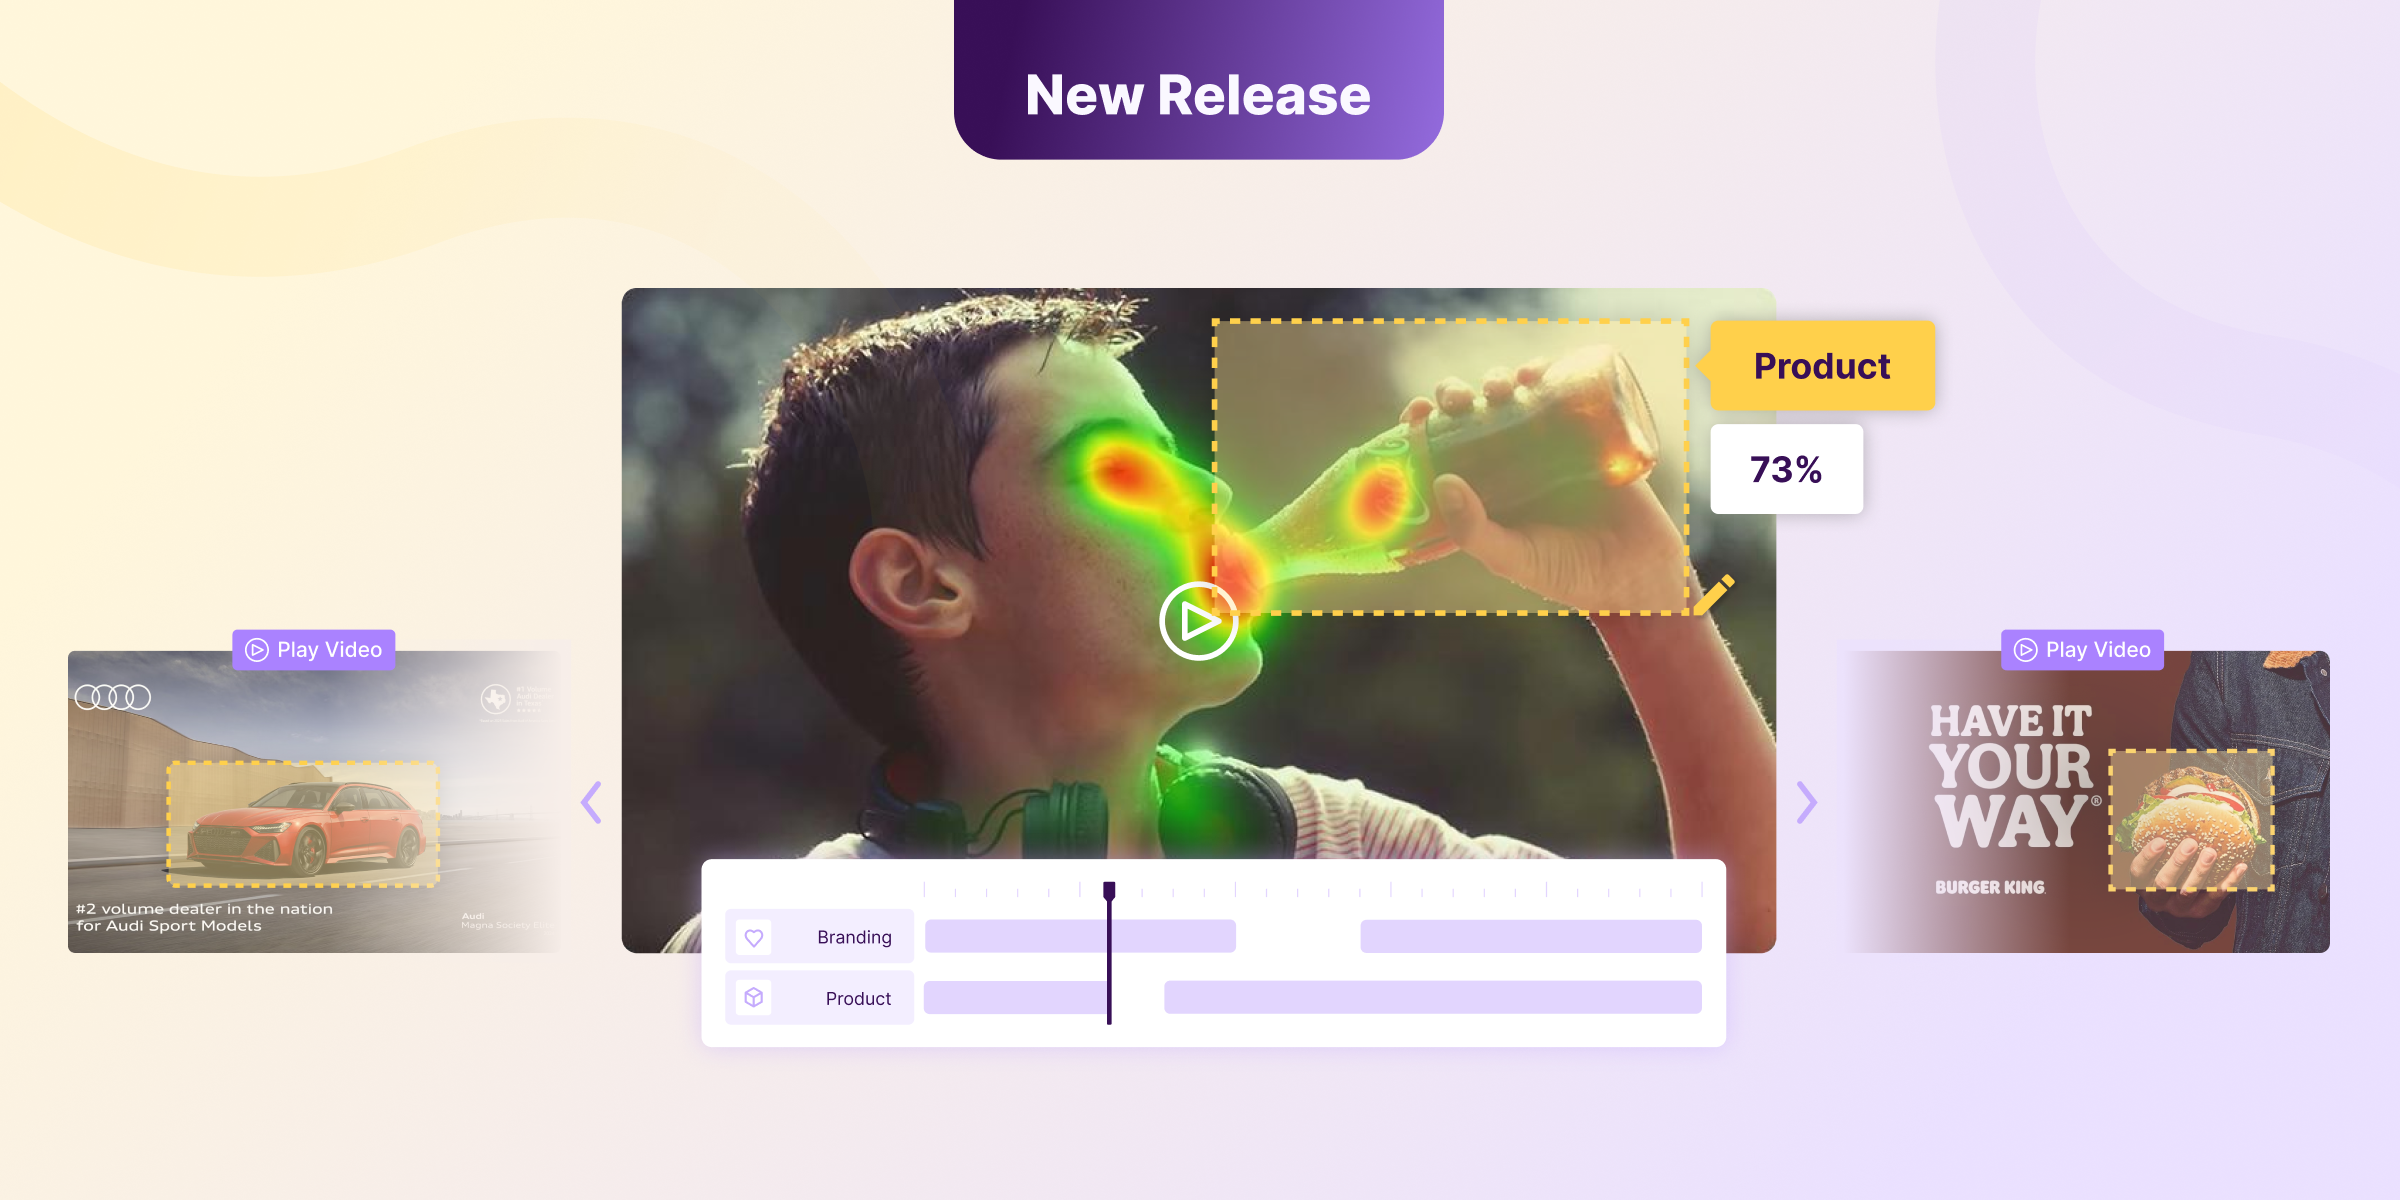
One way to explore this is by measuring Focused Attention using eye-tracking. This metric is based on eye-tracking and is an invention by the team behind Neurons. The Focused Attention score (see below) shows how coherent a group’s gaze is while watching a video ad. In general, low scores suggest that a group’s gaze is “all over the place”. Contrarily, the higher the Focused Attention, the more coherent the group is in where they look at. That means that there is a higher chance of pointing out the different ad components – and therefore receiving the promotional message.
When we measure Focused Attention, one thing to look for are attention peaks. High peaks (Focused Attention score > 80) suggest that the group focuses on the same piece of information, while low peaks (Focused Attention score < 40) indicate that attention is scattered across the group.
Take the “More for your thing: Barbershop” ad of Direct TV for example. This ad is very successful in keeping high Focused Attention throughout the video. The only “weakness” in terms of Focused Attention appears towards the end, when the main ad text appears – and that’s expected, as viewers will inevitably direct their gaze to different areas while reading.

What’s more, breaking down the ad into its different components, or Areas of Interest (logo, product, slogan, etc.), can further tell us which elements get noticed and for how long. In the Direct TV ad for example, consumers can clearly point out the major branding components, spending on each more than 20% of the time they were shown during the ad. So in this case, “The Barbershop” offers a great opportunity for effective brand communication.
How much is just enough?
Attention alone, though, does not guarantee that the ad’s message will finally be communicated. Complex messages might confuse consumers with excessive information they cannot process, while oversimplification hides the risk of “losing” the audience in a boring context. So how can you tell when information is just enough?
To answer this, brain monitoring techniques (electroencephalogram -EEG- recordings) are used to measure Cognitive Load (1). In other words, the degree of information processing while consumers watch a TV ad. Cognitively engaging ads – the ones that generate optimal cognitive load scores – are more likely to be comprehended and remembered. And with that comes better ad and brand recall, which is the end goal of advertising in the first place.
Cognitive Load is always seen in the scope of Motivation, which is highly predictive of actual preference and choice. The score has a cutoff at 50, in which higher scores denote positive “approach” behavior, while scores below 50 suggest negative “avoidance”.
But when it comes to details, do you know if people consider your slogan interesting, or whether they are bored reading your promotional text? Again, by looking into a second-by-second analysis of Cognitive Load and by assigning different Areas of Interest, you can get your answer.
Some ads are great at giving just enough information, capturing the audience and keeping interest high, like Caterpillar’s “This is huge”. Others, however, could use some improvement. The recent Bank of America’s ad “The Power to Make a Difference”, for example, comes out with a strong and engaging slogan. Nevertheless, the combination of an overloading call to action (CTA) with a rather dull main promotional text, as revealed by low Cognitive Load and Motivation scores, is not that promising. This combination of low scores basically suggests that viewers are tuning out both emotionally and cognitively, which in turn will lead to a lower ad and brand memory.
Fortunately, shortfalls like this can easily be turned into an advantage. There is a great opportunity for targeted improvements in these communication elements that simply don’t work; a chance that could have easily been missed without the help of NeuroMetrics.

How to decipher emotional responses
It’s no secret that marketing has long been using ads with high emotional content to influence consumer behavior. And that’s for a good reason: emotional responses towards an ad or brand influence intent to buy, as well as consumer loyalty.
Traditionally, market research uses surveys to assess an ad’s emotional impact. Brain-monitoring, on the other hand, allows us to delve deeper into consumers’ subconscious emotional responses, and even determine which specific ad elements evoke positive or negative feelings (2).
By analyzing brain responses to each ad scene and by assigning an Area of Interest to each branding component, we can identify peaks in both Arousal and Motivation. Then we can identify the specific scenes or ad elements that are emotionally engaging. Going back to Caterpillar’s “This is huge” ad for example, it’s easy to see that Arousal and Motivation are kept high throughout the video. Appealing to price psychology, the final offer – in other words “0% or get a ton of cash back!” – gives a pleasant boost in Motivation.
Arousal and Motivation analysis gives us information on the Persuasion Power of an ad, as we can conclude how well it resonates with consumers. Scenes with low scores in both metrics suggest dislike, while the opposite is seen in feel-good scenes.
However, high arousal can also be a sign of frustration or even fear. To distinguish between positive and negative emotional states, we use the Motivation metric. A combination of high Arousal with low Motivation would immediately suggest frustration and stress, while high values in both metrics is a sign of positive feelings and emotional engagement.
So, the combination of eye-tracking and brain-monitoring gives us a rich data pool to thoroughly explore the subconscious responses that determine advertising success. By using Second-by-second analyses and breaking down ads to each of their branding elements, an opportunity arises. We can now determine what really works and what not.
Interested in conducting your own consumer neuroscience study on consumer attention? Try Neurons, our attention AI tool that can analyze video and image ads based on neurometrics in just seconds. Book a demo to learn more.
References
- Berka, C. et al. EEG correlates of task engagement and mental workload in vigilance, learning, and memory tasks. Aviat. Space. Environ. Med. 78, B231-44 (2007).
- Chanel, G., Kronegg, J., Grandjean, D. & Pun, T. Emotion Assessment: Arousal Evaluation Using EEG’s and Peripheral Physiological Signals. in LNCS, volume 4105, 530–537 (Springer, Berlin, Heidelberg, 2006).