Performance dashboards show which ads hit their numbers, but not why.
For most insights teams, that’s the hardest part of the campaign report to write. This post shows how Campaign Insights helps.
What campaign reports usually leave out
Reach, clicks and brand lift show what happened. They don’t show what people noticed, what held their attention or what they’ll remember.
Getting that usually means a panel and weeks of fieldwork. So most teams skip it, or piece it together ad by ad.
How Campaign Insights works
Campaign Insights looks at all the ads you’ve tested in Neurons from one campaign, quarter or market, and pulls out what they have in common. That way you can see which creative choices worked across the whole set, and which didn’t.
What’s in a Campaign Insights report
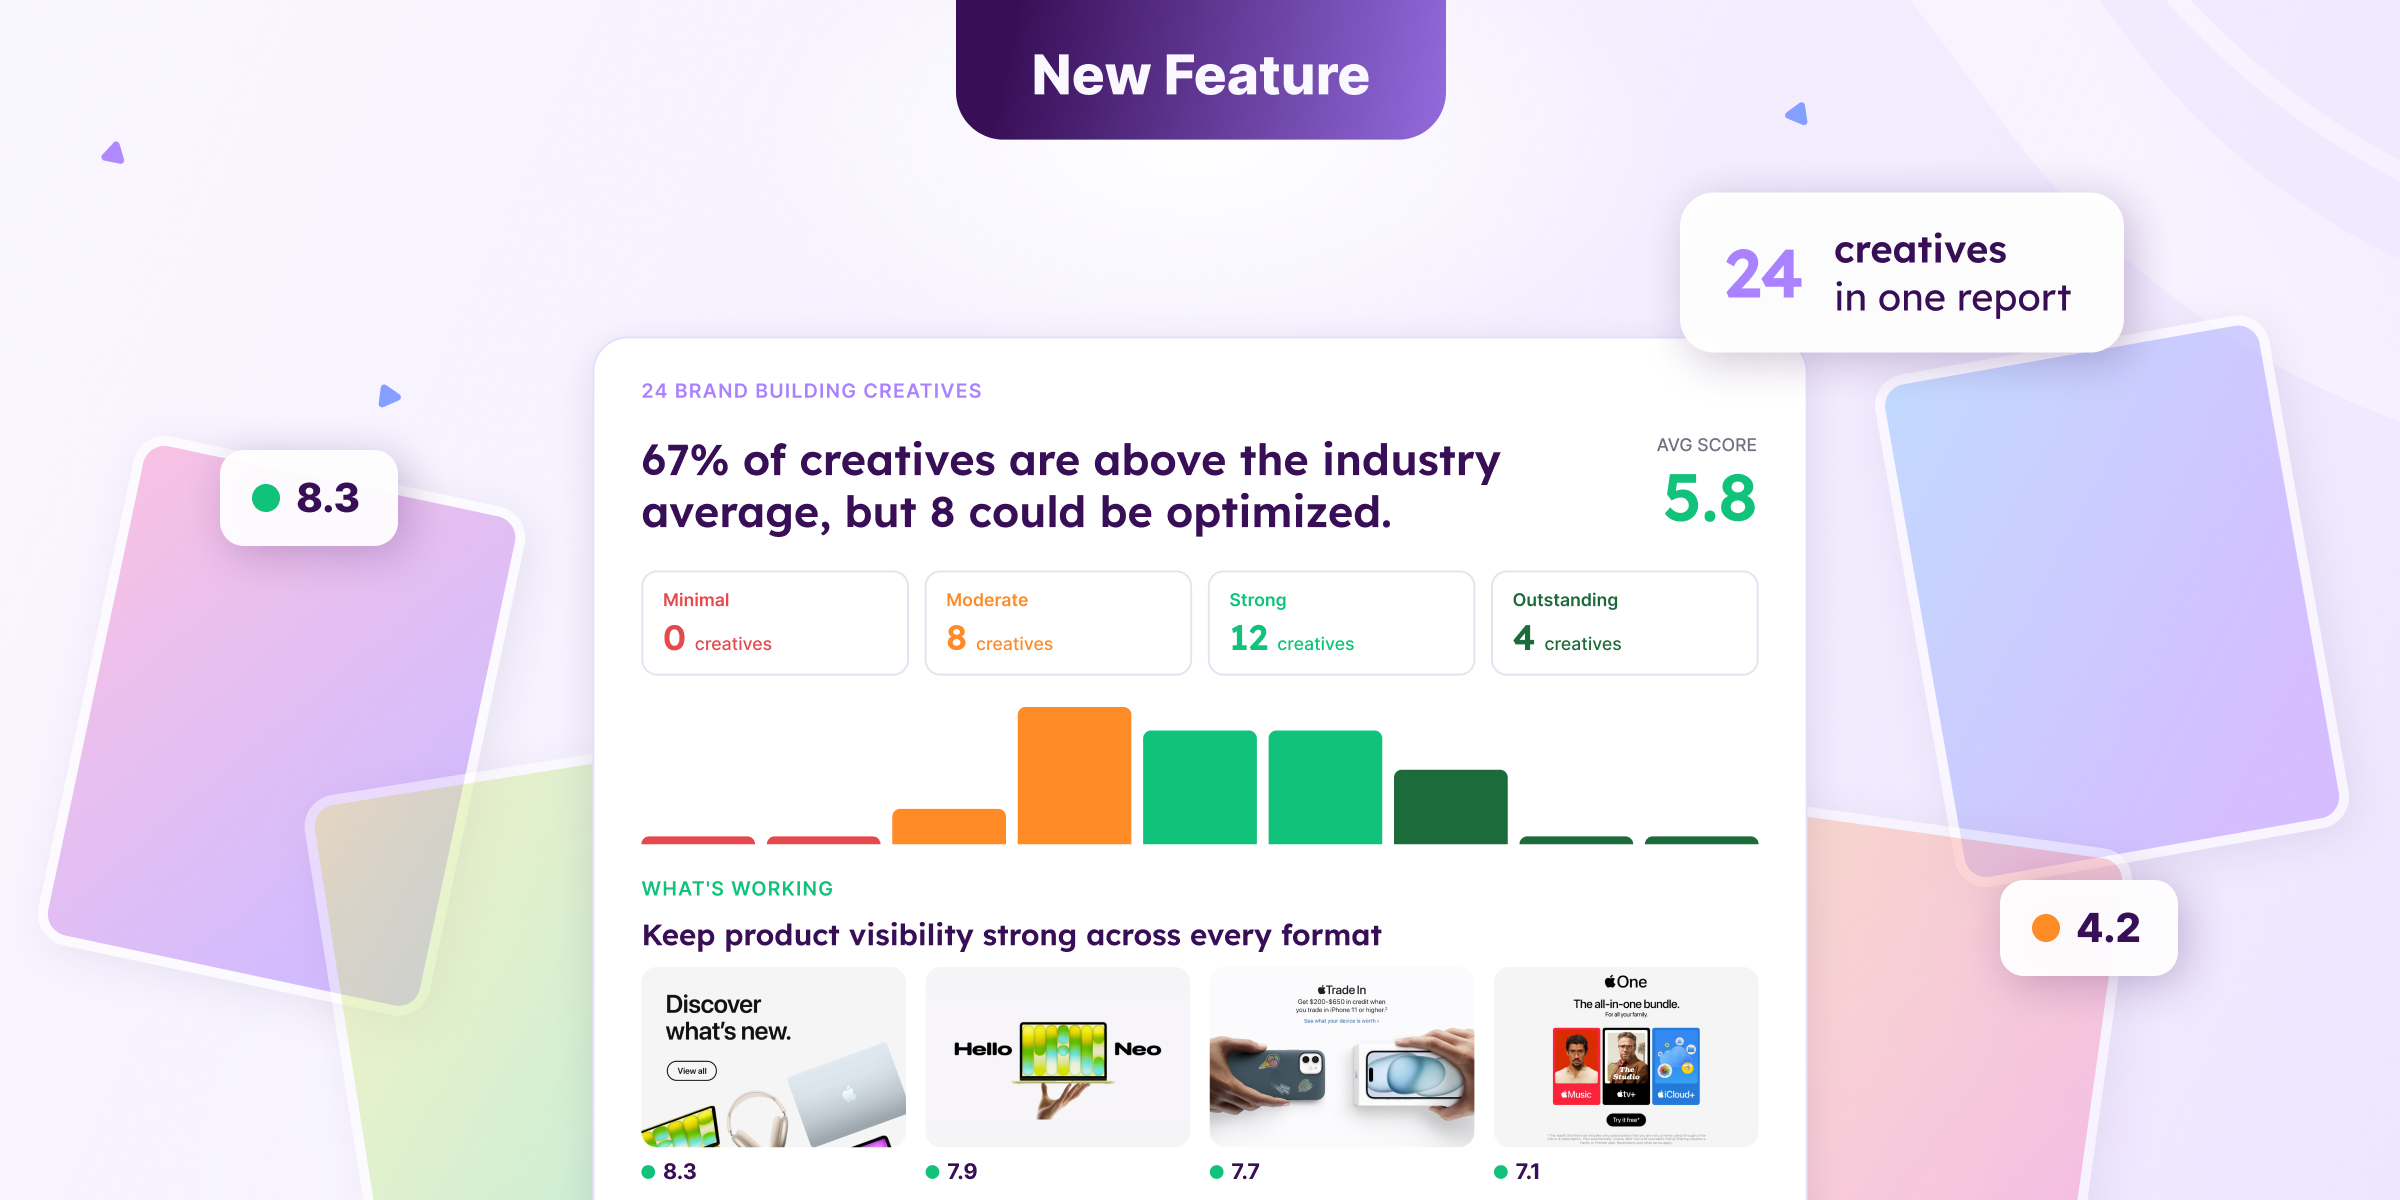
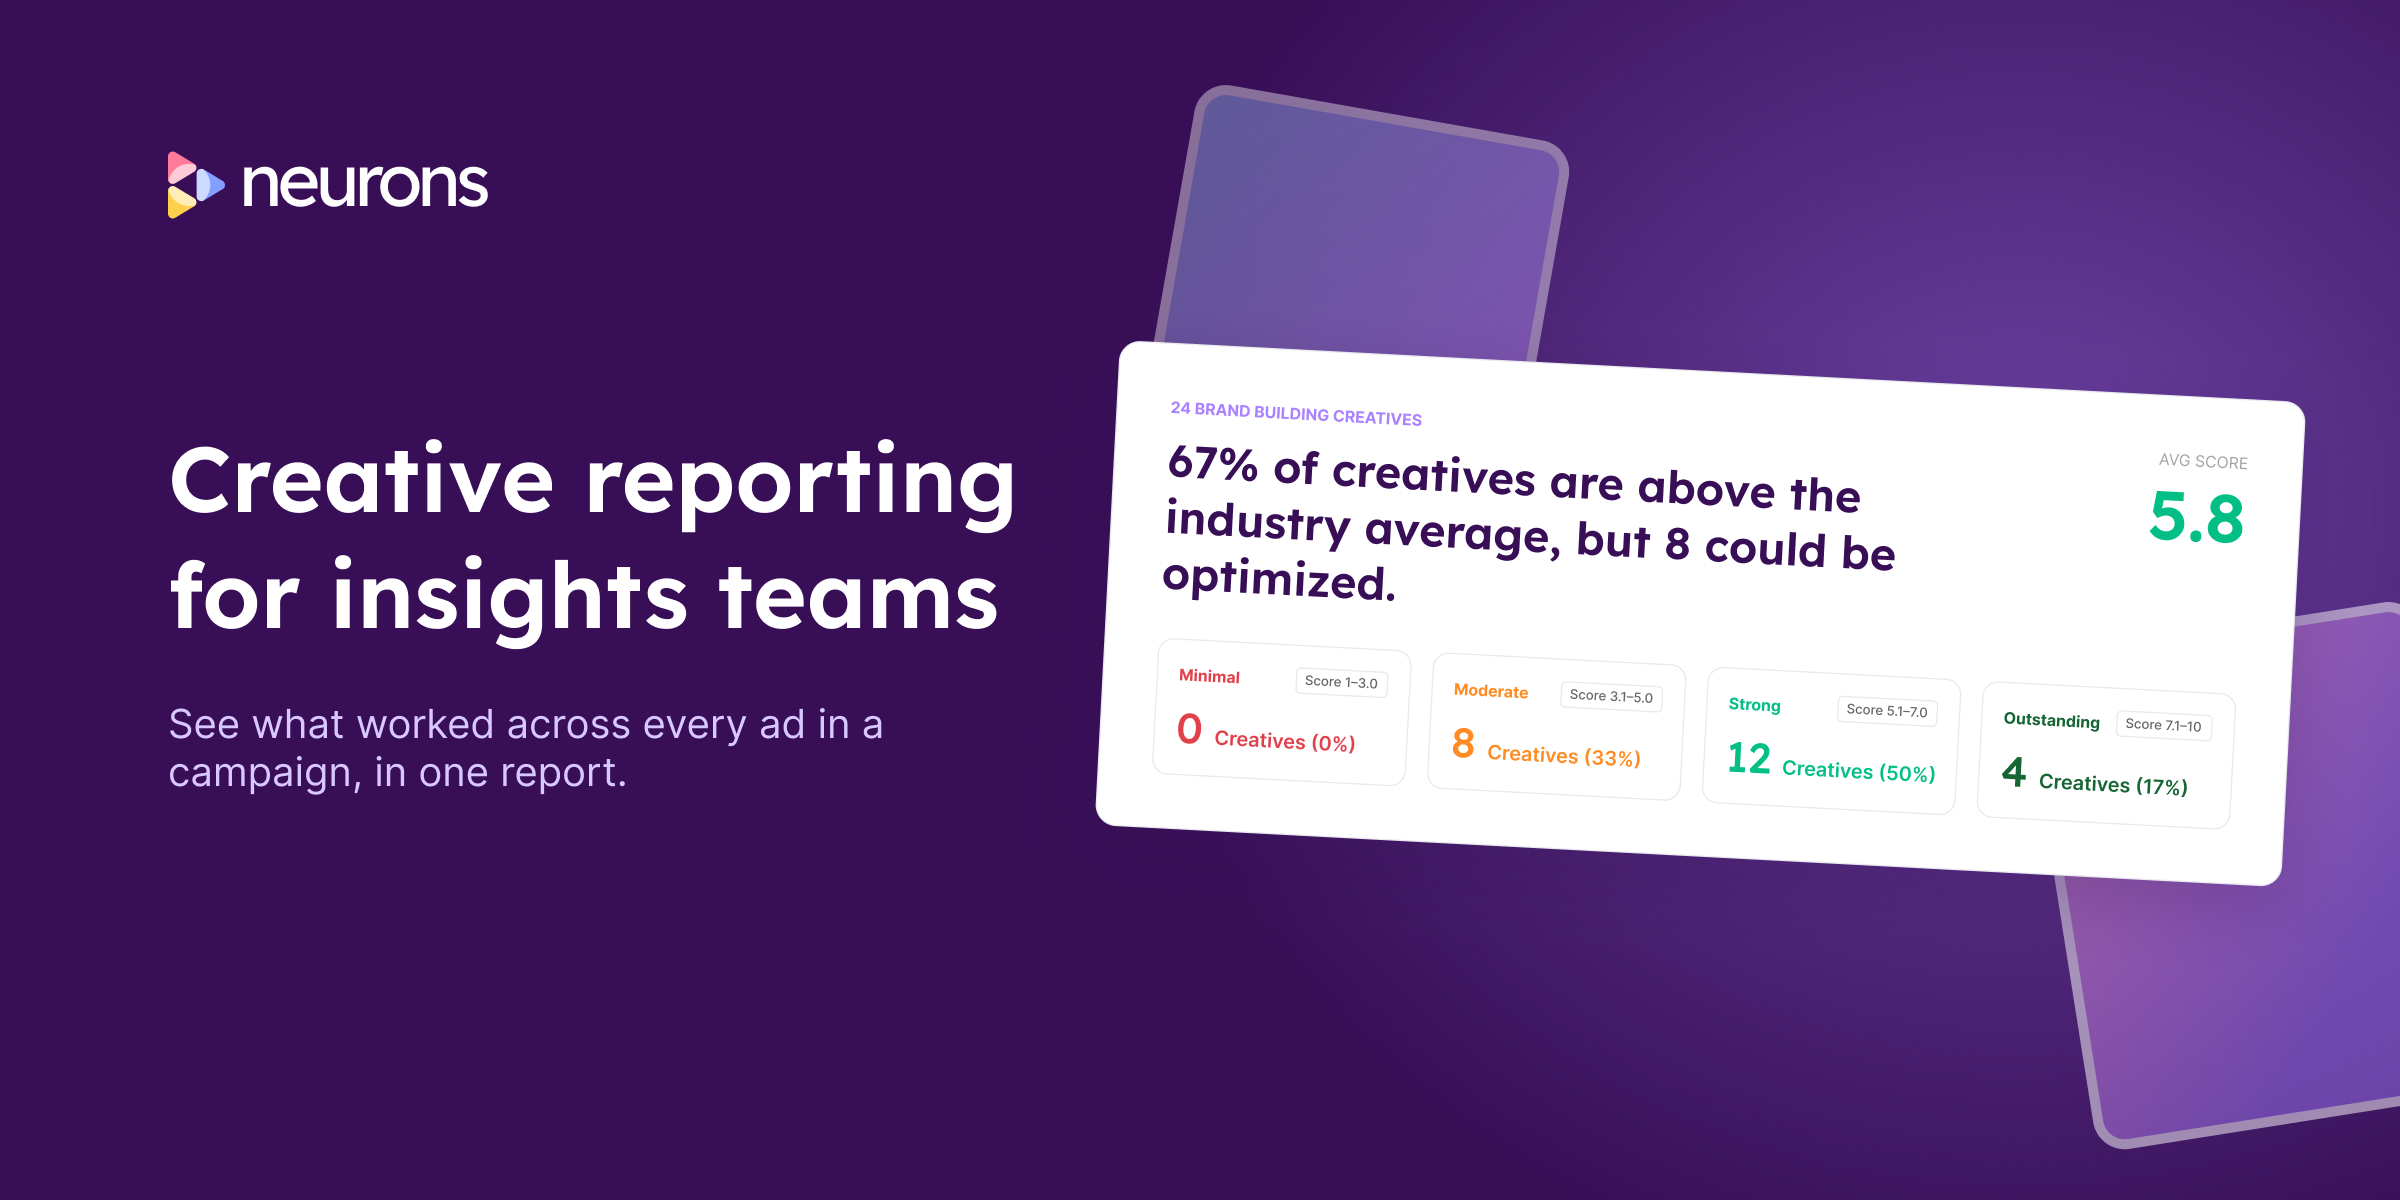
Every report opens with one sentence on the whole campaign, like: “91% of creatives perform above the industry average, while 9% could be optimized to lift product visibility.” Under it, you get:
- The average Neurons Impact Score for the campaign
- What’s working, with the best examples
- What needs fixing, and three changes to make next time
You can add it to your quarterly review or leadership deck, next to your performance and brand tracking data.
Run a report after every campaign
Over time, the reports show what works for your brand and which problems keep coming back.
Already using Neurons? Log in and run a report on last quarter’s ads.
New here? Book a demo and see what your next campaign report could look like.