News in a nutshell
Are you curious about how many people will see your ads and assets?
The next-gen Neurons AI model will give you these exact insights.
The advanced AI model will be able to estimate the percentage of people who notice key components of an ad, as well as predict the duration they spend on viewing those elements.
Scope of the study
Imagine a bustling city, full of people from all walks of life. As they meander through the streets, they encounter countless visual cues that shout for attention. The question is: what captures attention and stands out from the rest? This is precisely what our researchers have set out to unravel in their pursuit of understanding how we, as humans, focus on specific Areas of Interest (AOIs).
We run eye-tracking studies that shed light on the intricacies of human attention. These studies provide valuable data on how different visual elements draw attention by measuring where people look and for how long. We can also translate these findings and predict the percentage of how many people will look at a specific AOI.
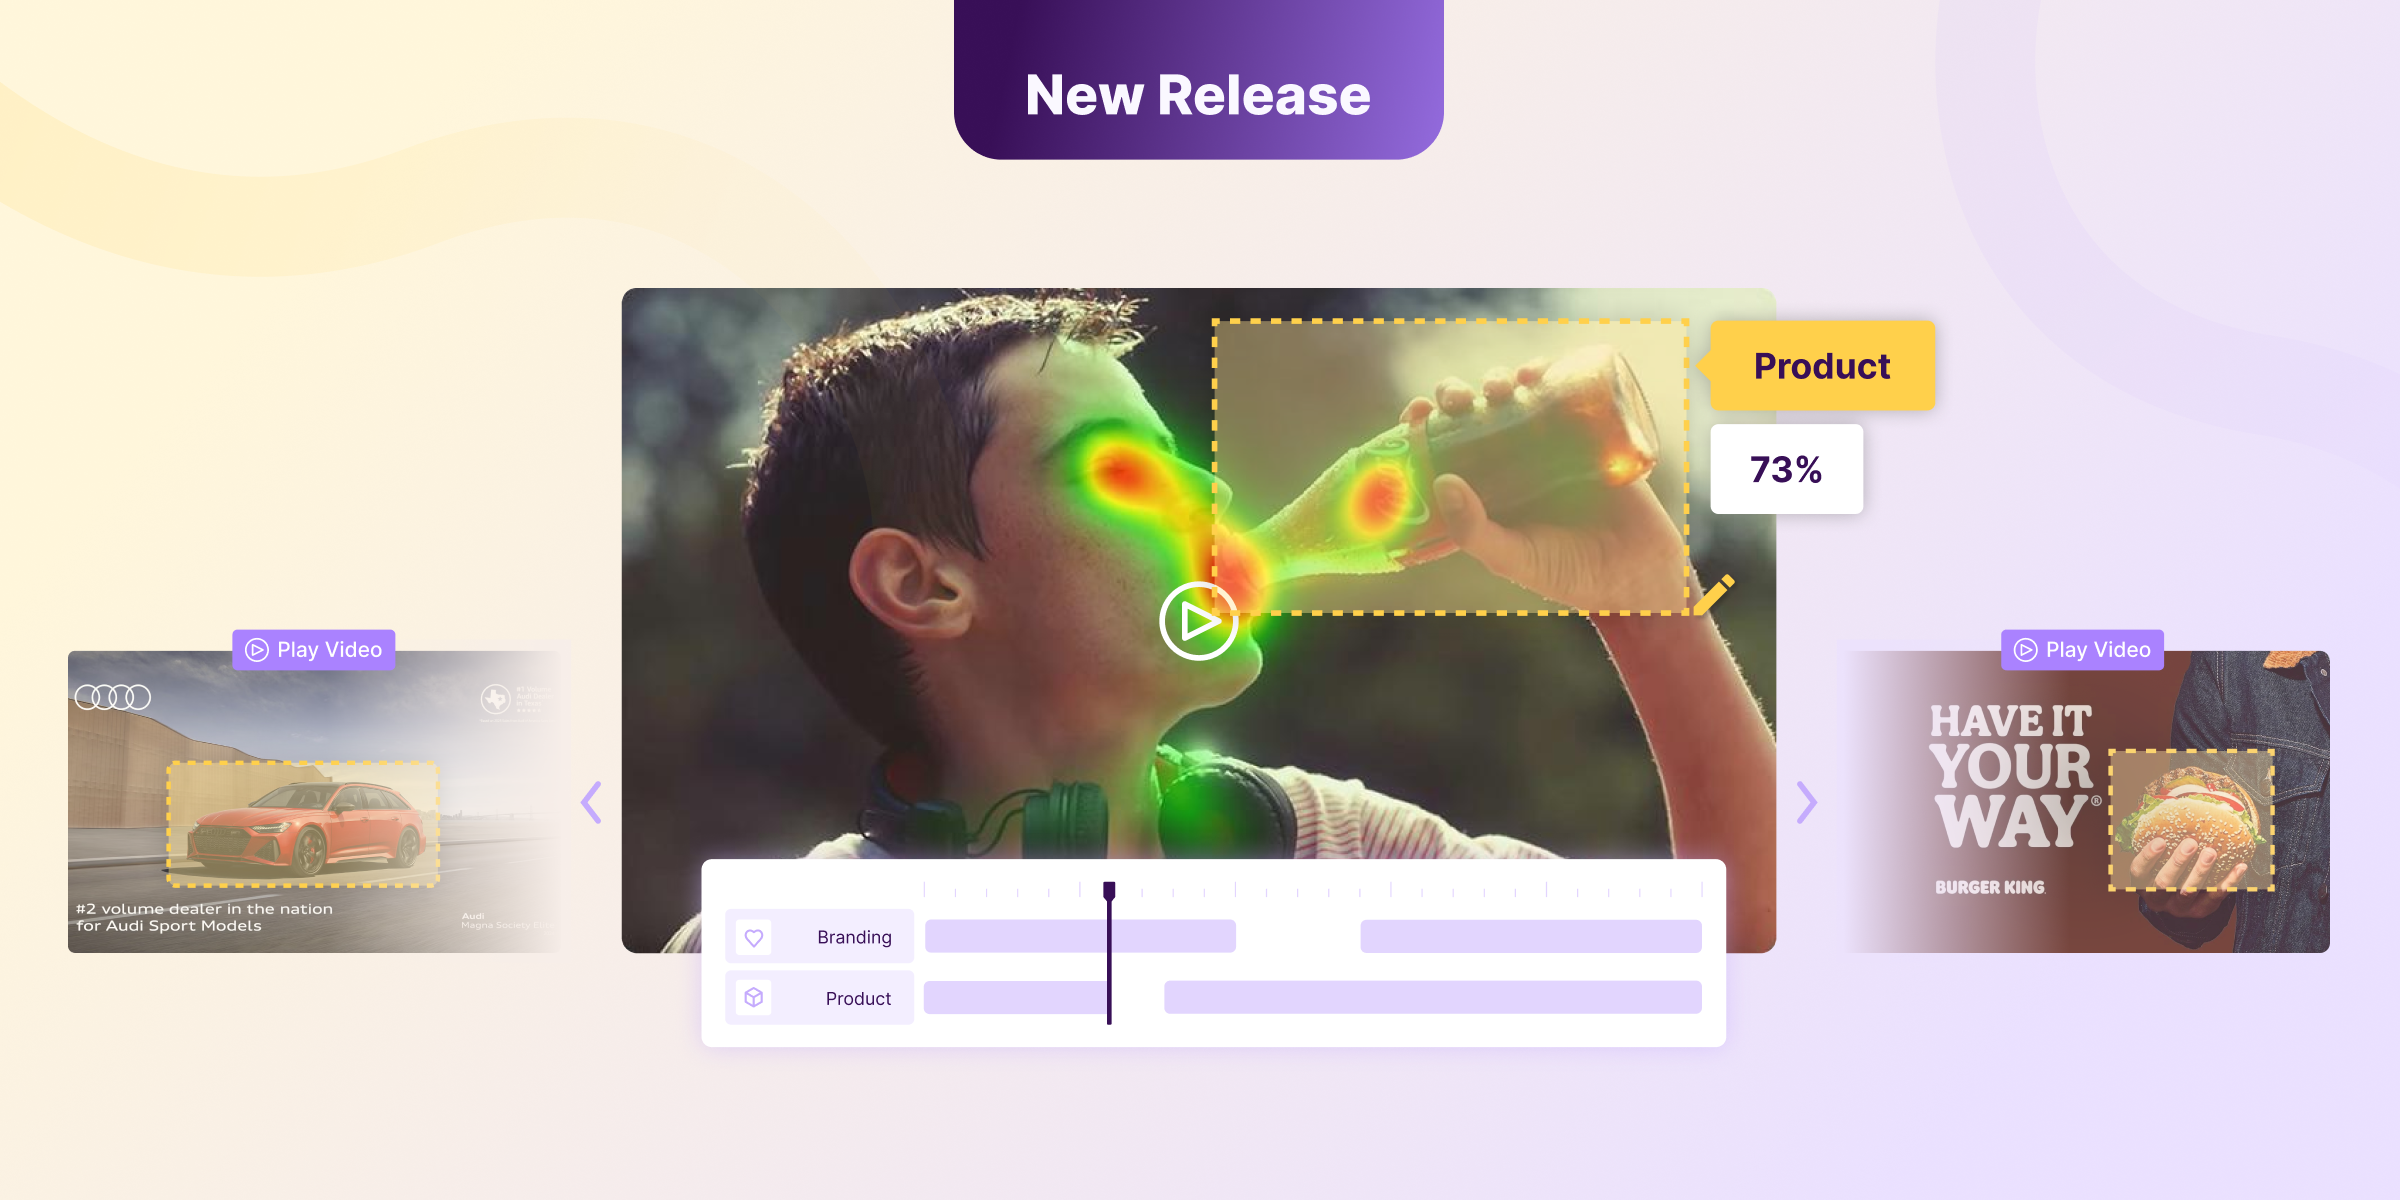
Just like on the above animation, AOIs show the percentage of visual attention that falls inside a specific area of an image. To develop the revolutionary formulas that estimate view time and the percentage of people who notice key components of an ad, we analyzed eye-tracking data of eye movements, specifically eye fixations.
Validated by data from our eye-tracking studies, the Neurons AI attention model offers valuable predictions about the duration users spend examining an asset (TFD-based) and the probable number of viewers (% Seen).
What we set out to do
We were looking to establish the correlation between Neurons AI’s Attention score and two other key metrics measured from eye-tracking studies: the percentage of people who see an AOI and the total fixation durations (TFDs) on that specific area. TFD is an important metric to measure as it represents the relative engagement with an object.
The Attention score was calculated from the participants' actual eye-tracking attention to an AOI. It is this data that the Neurons AI attention algorithm is trained on. We measured attention for 5-second exposures. From the full recording, we considered that the whole image has an Attention score of 100%, and then we attributed the attention % of each individual AOI.
% Seen is a metric in eye-tracking data that measures how many people look at a specific area of a visual stimulus or image. It is calculated by analyzing eye-tracking data and counting how many people that look within a certain area of the screen with a minimum of one fixation (typically around 60 milliseconds) and then dividing this number by the total amount of participant who were exposed to the image. For example, if 50 out of 100 participants looked at a specific AOI, then the % Seen score for that AOI would be 50%.
Total Fixation Duration (TFD) is the total time someone's eyes focus on a specific area, like an ad or webpage element. It's important because it shows what catches people's attention and how long they're engaged. Analyzing TFD helps us build models that help optimize visuals to capture and maintain interest, leading to better marketing outcomes.
Measuring advertising attention with eye-tracking
We looked at the correlations between:
- Neurons AI’s Attention score and measured TFDs.
- Neurons AI’s Attention score and % Seen (the percentage of people that will look at an AOI in an image at least once).
One caveat to the new metrics is that the eye-tracking analysis was done assuming a fixed duration of the images of 5 seconds. The study did not examine time to first fixation (TTFF) but is part of our future research.
We ran an eye-tracking study with the following set up:
- Participants: We recorded the eye movements of 177 people from five different countries (i.e., Denmark, USA, Brazil, Guatemala, and Iran).
- Imageset: A total of 170 images were used and analyzed in this study from the stimuli pool of our eye-tracking study on cultural differences. The images were divided into 6 categories (i.e., product packaging, static ads, desktop website, mobile website, SoMe ads, and video ads) with ca. 30 images in each category. See all assets & heatmaps from the study here.
- Eye-tracking: All participants were exposed to each image in a pseudorandomized manner, without any particular task. We used a stationary eye-tracking device (screen-based Tobii Pro Nano eye-tracker) to record participants' eye movements to create heatmaps overlain on each image and as saliency maps that represent the concentration of visual attention for each image across the group.
- AOIs: Various types of AOIs were drawn on each image, most of them including branding, product description, product, ad text, front page, web text & subtext, CTA button & creative for SoMe ads.
Predicting the % of viewers who notice key ad elements
We then developed a formula that translates our attention AI model’s predictions into the percentage of people viewing AOI.
We found a 74% accuracy (R2 = 0.74) between Attention and % Seen via a so-called third-degree polynomial model. Based on this, we were able to create a formula to accurately estimate % Seen based on an Attention score (and an Attention score based on % Seen) based on participants viewing an image for 2 seconds.
Predicting view time on any element of an ad
We developed a formula that translates our attention AI model’s predictions into AI predicted attention % towards AOIs into the amount of time spent viewing them. Even high attention to an entire visual asset can translate to a limited time spent on key areas.
We found an almost perfect 0.99 correlation (Pearson) between Attention score and TFDs. We were able to create a formula to accurately estimate TFD based on an Attention score (and an Attention score based on TFD). Additionally, we found no significant differences in this relationship for different types of AOI or image types, so the formula can be used for all types of AOIs.
Significant steps in attention prediction for advertising
With the formula, you can now use Neurons to know both how many people are likely to see your assets, and the amount of time they are likely to spend viewing them. The table below shows examples of Attention scores and % Seen.
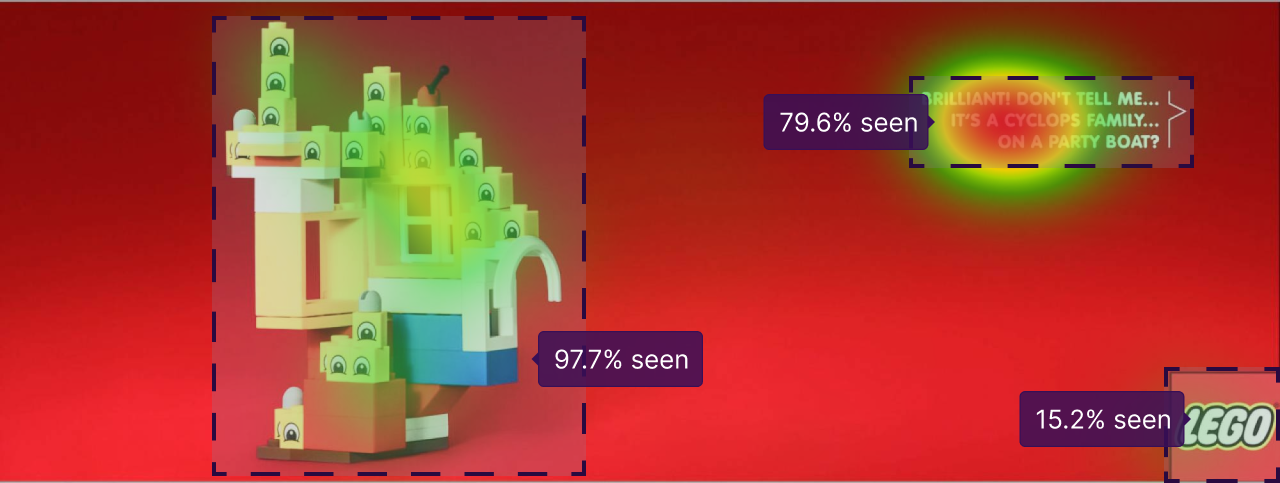
The image below shows an example of AOIs with a calculated % Seen scores. The ‘Product’ AOI has score of 97.7%, while the ‘AdText’ is predicted to be seen by 79.6% of all viewers, and the ‘Branding’ AOI has the smallest % Seen score of 15.2%.
Clients will also be able to estimate the amount of time they are likely to spend looking at an AOI, at least once, based on the Attention score for the item. The table below shows examples of Attention scores and TFD.
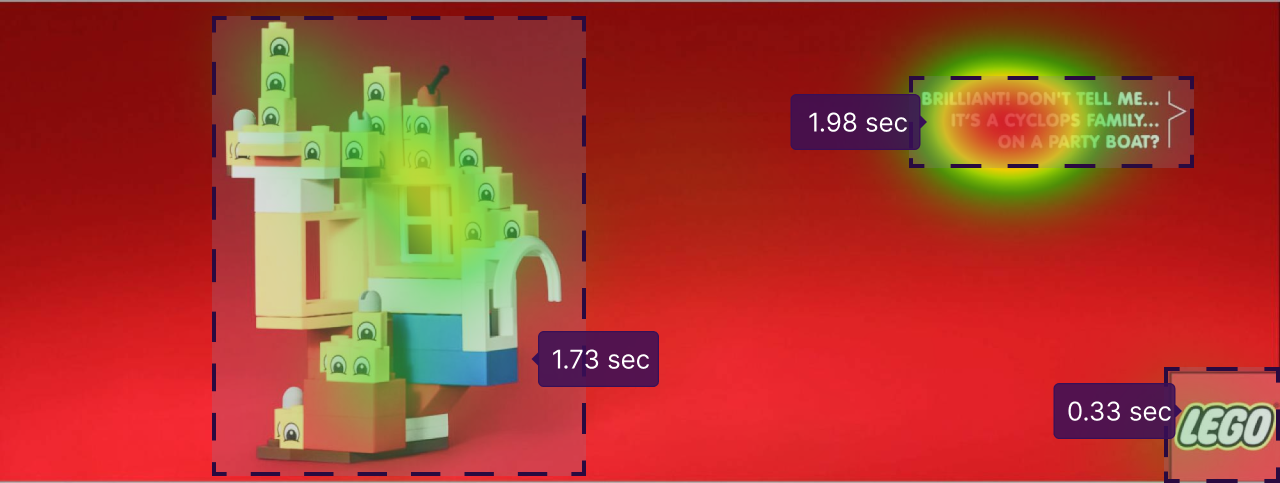
The image below shows an example of AOIs with a calculated TFD scores. The ‘Product’ AOI has a TFD score of 1.73 seconds, while the ‘AdText’ gathered 1.98 seconds of TFD, and the ‘Branding’ AOI has the smallest TFD score of 0.33 seconds.
The TFD score allows clients to know whether critical assets are seen long enough to be processed. For example, 0.33 seconds for the LEGO logo is barely enough to be seen - however as viewers are more engaged with the product and copy, the well-known brand can still boost brand awareness and benefit from running this ad.
Why is this important?
The new-gen attention model is a significant step forward in predicting viewer engagement with visual assets. It can accurately predict the percentage of people who will see key elements of an ad and estimate the amount of time viewers will spend on these elements.
With this information, clients can see which key elements of an ad are likely to capture the most attention, optimize their visuals accordingly and tailor them to their goals like boosting brand awareness. With this valuable information, marketing leaders can make data-driven design decisions that lead to better marketing outcomes.